PHARMA:
Trial Site Management
DECEMBER 2024
DECEMBER 2024
Trial Site Management Organizations (SMOs), which specialize in managing critical aspects of clinical trials—such as patient recruitment, site coordination, and data oversight—are experiencing rising demand. This growth is fueled by expanding drug development pipelines and the increasing need for streamlined trial execution.
Ongoing advancements in drug development play a key role in driving industry growth and expanding treatment options.
The rising number of clinical trials reflects increased investment and progress in developing new medical treatments.
A robust R&D environment fosters innovation, ensuring a steady flow of new drugs and therapies to the market.


Record-high R&D spending is expected to sustain future growth within the industry, ensuring a steady pipeline of inflows for clinical trial sites and management organizations.

The increase in R&D funding has already strengthened the U.S. drug pipeline and is expected to continue enhancing it, leading to more clinical trials being initiated. Although the total number of trials has decreased and normalized after a COVID-related surge in 2021, the rise in rare disease trials reflects a shift in research priorities that is driving continued growth in trials moving forward.

The number of drugs in active development has consistently grown since 1995 in the U.S. with an average increase of 248.8 drugs per year, a 4.8% increase YoY.
![]()


Source: Citeline, IQVIA, Publicly available information
Utilization of site networks and SMOs has been rising, driven by trust in their ability to manage larger, more complex trials, particularly in later stages, as well as increasing costs and challenges with patient recruitment and enrollment.


1. Increasing Trial Complexity
As clinical trials become more advanced, SMOs and site networks are handling increasingly complex protocols, particularly in Phase II and III trials. This growth reflects the rise in trials for rare diseases and personalized medicine, both of which require more sophisticated trial designs and management.
2. Elevated Cost of Trials
With the growing complexity of clinical trials, costs are rising across all trial phases. Larger trials, more complex protocols, and the use of advanced technologies contribute to this increase. SMOs are critical in managing these costs efficiently, providing infrastructure and expertise to streamline operations.
3. Challenges Surrounding Patient Recruitment and Enrollment
Despite advances in trial design, patient recruitment and enrollment remain significant challenges for providers. As trials become more complex and target more niche populations, identifying and engaging eligible participants has become increasingly difficult, leading to delays and increased trial costs.
Source: L.E.K. Consulting, Publicly available information
More procedures per trial indicate a significant increase in the demand for more detailed and complex data collection
Increase in total number of investigative sites (2010 – 2020), indicating expansion of geographical and logistical scope of trials
More total endpoints reflect the growing need to capture a wider array of outcomes for regulatory and therapeutic purposes
Average number of data points generated in phase 3 trial, a 3x increase from a decade ago (2010 – 2020)
Substantial amendment is expected to be made during the trial process in...
The growing complexity of trials, with more procedures and data demands, has led to greater reliance on SMOs. They are essential for handling operational challenges, managing frequent amendments, and ensuring trials stay on track efficiently.
Source: Tufts Center for the Study of Drug Development (CSDDD), Publicly available information
Spiraling clinical costs have become a major sponsor pain point, driving increased SMO utilization as they address trial complexities and patient enrollment challenges, which continue to cause delays and extend trial durations, ultimately increasing costs further.

Source: L.E.K. Consulting, Publicly available information
The rise of personalized medicine, rare disease trials, and other market forces has increased pressure on patient enrollment, causing significant delays. This opens up more opportunities for SMOs that offer recruitment services to address these challenges efficiently.

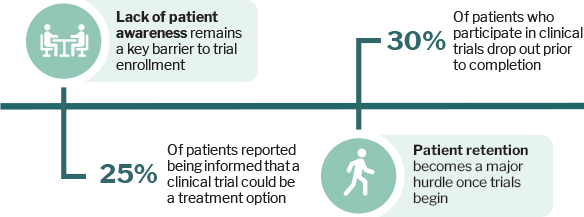
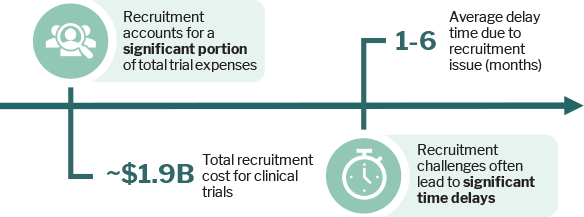
Source: National Library of Medicine, L.E.K. Consulting, Publicly available information
Regulatory and legislative actions are increasing oversight within clinical trials, which may add further pressure to an already challenging patient recruitment environment.
The Food and Drug Omnibus Reform Act of 2022 (FDORA) reauthorized the FDA’s user fee programs for five years, introducing several key reforms designed to modernize the trial process and improve outcomes for both sponsors and participants, including:
Section 3601 of FDORA promotes greater diversity in clinical studies. Sponsors are now required to submit "diversity action plans" for certain late-stage trials for drugs and devices, unless waived or excepted by the FDA.
FDORA mandated the FDA to issue guidance on decentralized trials, enabling the use of digital health technologies for remote data collection and patient engagement, which could improve recruitment and retention rates.
The act provides significant funding increases, including a $3.53 billion boost for the FDA. This additional funding supports clinical trials and healthcare research, strengthening infrastructure and resources.
FDORA allows the FDA to outsource specific services, such as inspection support and vendor approvals, to expedite the approval process.
The Clinical Trial Modernization Act (H.R. 8412), introduced in May 2024 as bipartisan legislation, aims to improve access to clinical trials by addressing financial and geographic barriers. The act seeks to reduce participant burdens and promote inclusivity by proposing key provisions, such as:
In June 2024, the FDA released draft guidance on Diversity Action Plans, outlining requirements for sponsors to enhance inclusion:
Sponsors are required to define specific enrollment objectives by age, race, ethnicity, and sex, ensuring that clinical trial populations reflect diverse patient groups.
DAPs must include strategies for enrolling and retaining underrepresented groups, like community engagement and resource allocation.
Sponsors should consider geographic location, socioeconomic status, and health conditions when designing recruitment strategies.
Source: Publicly available information
The fragmented SMO market is accelerating consolidation through single-site roll-ups and vertical integration by larger CROs. Financial sponsors are driving significant demand, outpacing the limited number of scalable platforms available, which in turn is pushing transaction multiples into the mid-teens for high-potential opportunities.

Reliable and rising demand SMO offerings further sustained by ongoing market trends as trial complexity, costs, and recruitment challenges rise.
The sector is highly fragmented with 20,000+ clinical trial sites in the U.S. while independent sites occupying 90%+ of the market share.
Site management and network prospects offer investors a haven away from risks and operational challenges of being associated with government or third-party reimbursement.
Sponsors are increasingly prioritizing positioning themselves as a 'sponsor of choice' in preferred arrangements with sites granting scaled SMOs greater pricing power and profitability.
Robust pharma R&D spending is expected to continue as several major patents expire and subsequent generic/biosimilar drugs enter the market.
Staffing shortages and high attrition rates are creating upward pressures on wages. Sites are averaging double the usual turnover rates seen in pre-covid levels.
The industry faces increasing scrutiny on trial processes and data management, with stricter FDA regulations raising costs and timelines for SMOs.
Source: Pitchbook Publicly available information
SMOs create value by expanding trials, improving site networks, and boosting efficiency through centralized operations and standardized systems. These factors are driving higher valuations from investors.
SMOs enhance business development and operational efficiency to consistently secure more trials and establish long-term partnerships with sponsors.
SMOs collaborate across multiple sites, leveraging expertise to boost referrals and enhance investigator networks with specialized knowledge.
Centralized operations and improved efficiency allow SMOs to scale patient enrollment and trial capacity across their sites effectively.
By moving into areas like protocol design, SMOs capture more revenue per patient, increasing their value in the trial process.
Integrating sites with standardized SOPs ensures consistency in service delivery, enhancing quality and reliability across locations.
Standardizing IT systems, including CTMS and eReg, across platforms boosts process efficiency and simplifies operational workflows.
Centralized management of finance and regulatory functions allows sites to focus more on clinical outcomes, driving operational efficiency.
Strengthening customer-facing teams, such as BD and customer service, enhances responsiveness and improves sponsor relationships.
Expanding recruitment reach and demonstrating the ability to identify and recruit diverse patient populations provides a competitive advantage.
Source: Publicly available information
|
Operator
|

|

|

|

|

|
|
Acquirer
|

|

|

|

|

|
|
Initial Investment
|
May 2021 | Dec 2021 | May 2018 | August 2018 | January 2018 |
|
Number of Sites
|
80+ | 30 | 20+ | 18 | 21 |
|
Total Investments
|
22 | 12 | 6 | 11 | 12 |
|
Recent
Add-Ons |
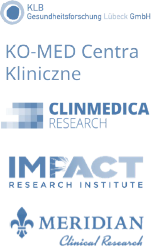
|

|

|

|

|
Source: Pitchbook Publicly available information
| Date | Target | Acquirer | Transaction Type | |
|---|---|---|---|---|
| September 2024 |  |
Was acquired by |  |
PE Buyout / LBO |
| July 2024 |  |
Was acquired by |  |
PE Buyout / LBO |
| July 2024 |  |
Was acquired by |  |
Corporate M&A |
| June 2024 |  |
Was acquired by |  |
Add-on |
| June 2024 |  |
Was acquired by |  |
Add-on |
| June 2024 |  |
Was acquired by |  |
Add-on |
| June 2024 |  |
Was acquired by |  |
Add-on |
| June 2024 |  |
Was acquired by |  |
Add-on |
| May 2024 |  |
Was acquired by |  |
Add-on |
| May 2024 |  |
Was acquired by |  |
Add-on |
| April 2024 |  |
Was acquired by |  |
Add-on |
| April 2024 |  |
Was acquired by |  |
Add-on |
| April 2024 |  |
Was acquired by |  |
Add-on |
| March 2024 |  |
Was acquired by |  |
Add-on |
| February 2024 |  |
Was acquired by |  |
Add-on |
| February 2024 |  |
Was acquired by |  |
Add-on |
Source: Pitchbook
This document is being provided in connection with an actual or potential mandate or engagement and may not be used or relied upon for any purpose other than as specifically contemplated by a written agreement with the Allen, Mooney & Barnes companies. This document is intended solely for the use of the party to whom it was provided to and is not to be disclosed (in whole or in part), summarized, reprinted, sold, redistributed or otherwise referred to without the prior written consent of the AMB companies.
Allen Mooney & Barnes Brokerage Services is a broker/dealer member of FINRA and SIPC. Allen Mooney & Barnes Investment Advisors, Inc. is an investment adviser registered with the U.S. Securities and Exchange Commission.
Information presented in this document is for informational, educational and illustrative purposes only. While the information in this document is from sources believed to be reliable, the AMB companies make no representations or warranties, express or implied, as to whether the information is accurate or complete and assume no responsibility for independent verification of such information. In addition, the analyses in this document are narrowly focused and are not intended to provide a complete analysis of any matter.
Past performance is not necessarily indicative of future performance. Estimates, projections or indications of future performance can be identified by certain statements, such as "believes," "expects," "may," "will," "should," "seeks," "approximately," "plans," "estimates" or "anticipates" or the negative of those words or other comparable terminology, as well as by statements concerning projections, future performance, developments, events, revenues, expenses, earnings, run rates and any other guidance on present or future periods. Any such statements are forward-looking in nature and involve risks and uncertainties. Any statements of future performance are based on assumptions that might not be realized and a number of factors, including without limitation, the volatility of the securities markets, the overall environment for interest rates, risks associated with private equity investments, the demand for public offerings, activity in the secondary securities markets, competition among financial services firms for business and personnel, the effect of demand for public offerings, available technologies, the effect of government regulation and of general economic conditions on our own business and on the business in the industry areas on which we focus and the availability of capital to us. We are under no obligation to update the information presented in this document or to inform you if any such information turns out to be inaccurate or misleading.
The information in this document is not, and is not to be construed as, an offer or a solicitation to buy or sell any securities or any other financial instruments or a recommendation or endorsement to engage in or effect any particular investment or transaction. Moreover, under no circumstances should the information in this document be considered legal, tax or accounting advice or relied upon, therefore. The recipient is advised to rely on the advice of its own professionals and advisors for such matters and should make an independent analysis and decision regarding any transaction based upon such advice.
The information in this document is not intended for distribution to, or use by, any person or entity in any jurisdiction or country where such distribution or use would be contrary to law or regulation or for any distribution or use that would subject the AMB companies to any registration requirement within such jurisdiction or country.
677 King Street, Suite 410 | Charleston, SC 29403
AMB focuses on lower middle-market healthcare niches where consumerism and fragmentation meet to disrupt traditional healthcare channels. We typically advise companies with EBITDA of $5M to $20M and an average enterprise value of $100M, but will move up and down the spectrum. AMB’s research-oriented approach to business development has resulted in a vast network of strategic and financial sponsor relationships that yield industry leading intelligence and optimal outcomes for our clients.
Managing Director
843-501-2183 Direct
mikel.parker@ambadvisors.com
Managing Director
843-405-1108 Direct
ryan.loehr@ambadvisors.com
Vice President
843-371-8596 Direct
johnny.cross@ambadvisors.com
Senior Associate
843-473-7981 Direct
kevin.williams@ambadvisors.com
Associate
843-576-4709 Direct
sully.hagood@ambadvisors.com
Analyst
843-405-1112 Direct
josh.hall@ambadvisors.com
Analyst
405-343-1643 Direct
asha.hamaker@ambadvisors.com
Analyst
843-271-5652 Direct
brayden.sarathy@ambadvisors.com